
Long Island Sound ‘Blue Plan’ Interconnected Watershed, Map Data
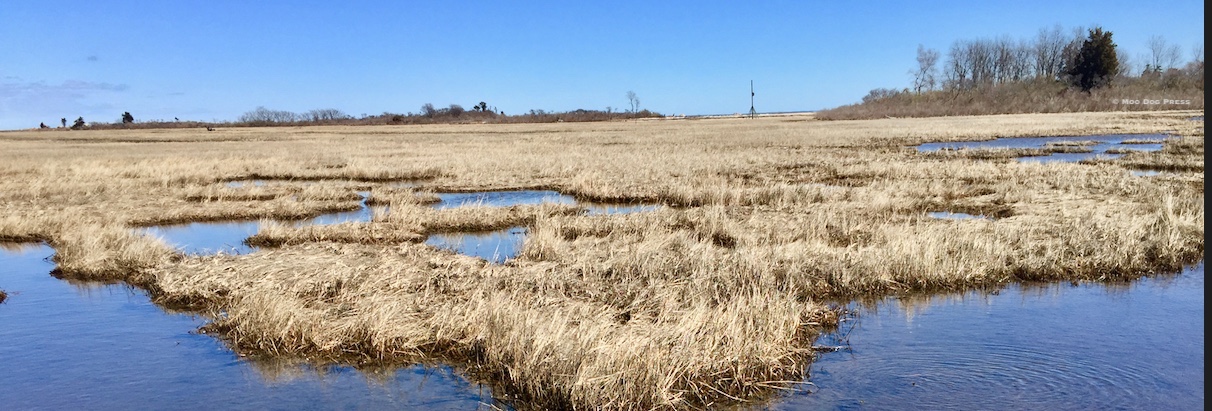
Water.
Salt, brackish, fresh – an essential element that draws humans and other species – necessary for life.But the interconnected interests — business to dredging to birding and biology, boating and marinas, fishing and shellfish; whale watching, tourism, sunbathing, swimming, beachcombing or aquaculture – all these and more that intersect at/on/under Long Island Sound (adding the big picture of the ocean/planet)? That is up to human beings paired with science, data, mapping, quality information. Update 3/11/2020. Since all water is endlessly recycled — and each small stream feeds larger bodies of water and so on to Long Island Sound and the ocean — what, if anything, will result from the increase in sanitizers being used during the current response to COVID-19?
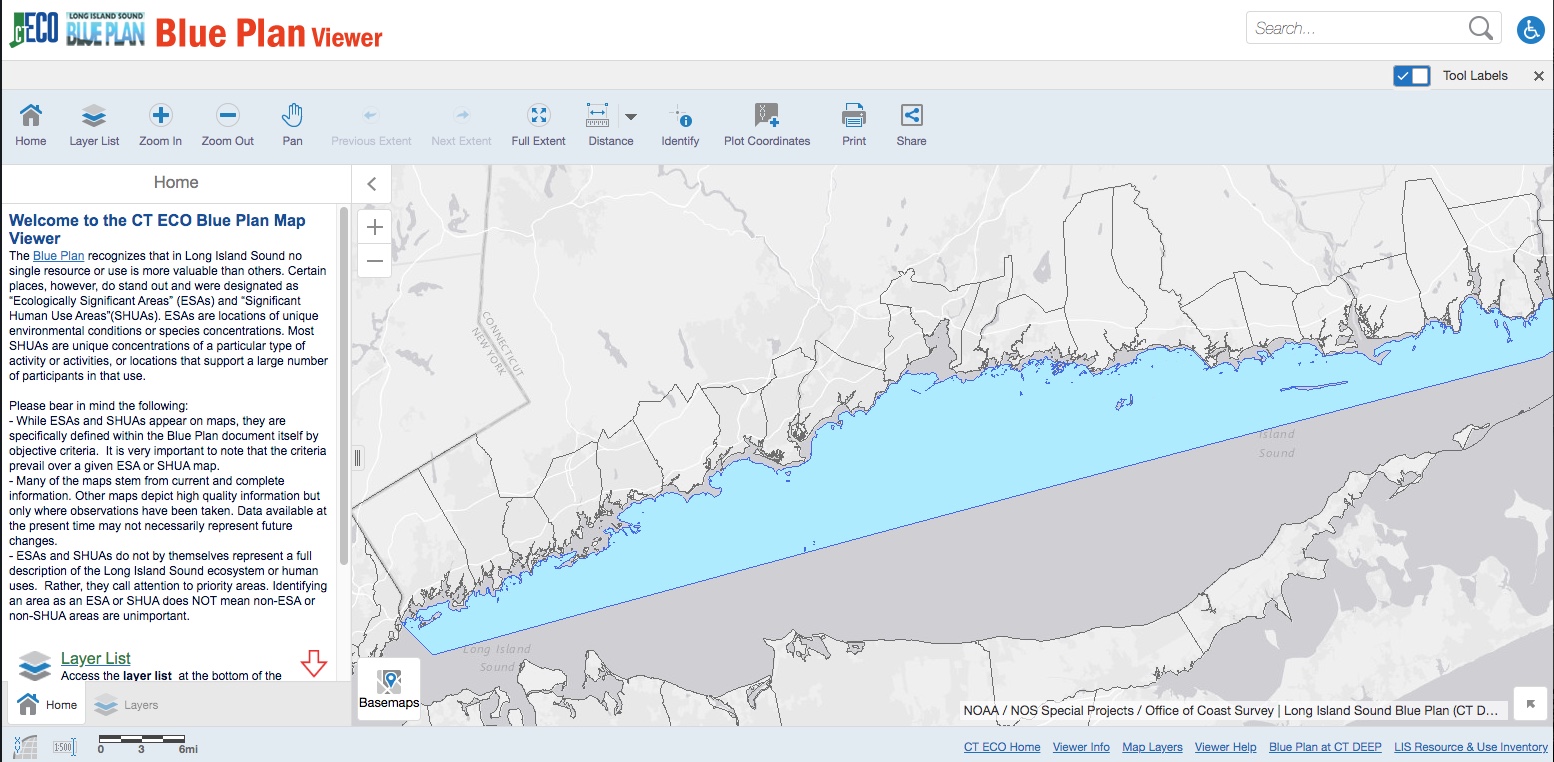
Blue Plan Viewer screenshot, linked to interactive site for exploration of data. “Click or tap a location on the map to plot a coordinate” — map data, the collaborative work of the Connecticut Department of Energy and Environmental Protection (DEEP) and the University of Connecticut Center for Land Use Education and Research (CLEAR) to share environmental and natural resource information with the general public. CT ECO’s mission is to encourage, support, and promote informed land use and development decisions in Connecticut by providing local, state and federal agencies, and the general public with convenient access to the most up-to-date and complete natural resource information available statewide.
Of interest is the data-rich (and fascinating) Blue Plan Map viewer with layers in a format for exploration. Zoom, pan, choose a layer, narrow, then expand focus.
Long Island Sound is a most valuable and interconnected resource for the region and beyond. The purpose of the Long Island Sound Blue Plan is to “protect traditional uses, minimize conflicts, and maximize compatibility, now and in the future. This includes preserving Long Island Sound’s ecosystems and resources, and facilitating a transparent, science-based decision-making process.”
“Welcome to the CT ECO Blue Plan Map Viewer: The Blue Plan recognizes that in Long Island Sound no single resource or use is more valuable than others. Certain places, however, do stand out and were designated as “Ecologically Significant Areas” (ESAs) and “Significant Human Use Areas”(SHUAs). ESAs are locations of unique environmental conditions or species concentrations. Most SHUAs are unique concentrations of a particular type of activity or activities, or locations that support a large number of participants in that use.
“Given that the overall estimated value of Long Island Sound in ecosystem benefits ranges from $9.4 billion (Long Island Sound Study, 2018) to $37 billion (Earth Economics, 2015) management based on quality data is paramount.”
– p. 243, Long Island Sound Inventory and Science Subcommittee of the Blue Plan Advisory Committee (2018).
From the Blue Plan introduction: “Long Island Sound hosts diverse uses including recreation, aquaculture, commercial and recreational fishing and boating, marine trades and transportation, and habitats for fish, shellfish, birds, marine mammals, and plants. Protecting offshore and coastal resources, traditional uses, and community character while simultaneously considering changing environmental conditions and proposals for new offshore activities presents a complex set of challenges. Comprehensive, coordinated, and proactive planning is needed to improve the Sound’s ability to support thriving habitats, abundant wildlife, and sustainable and resilient communities.”
“While ESAs and SHUAs appear on maps, they are specifically defined within the Blue Plan document itself by objective criteria. It is very important to note that the criteria prevail over a given ESA or SHUA map. Many of the maps stem from current and complete information. Other maps depict high quality information but only where observations have been taken. Data available at the present time may not necessarily represent future changes. ESAs and SHUAs do not by themselves represent a full description of the Long Island Sound ecosystem or human uses. Rather, they call attention to priority areas. Identifying an area as an ESA or SHUA does NOT mean non-ESA or non-SHUA areas are unimportant.”
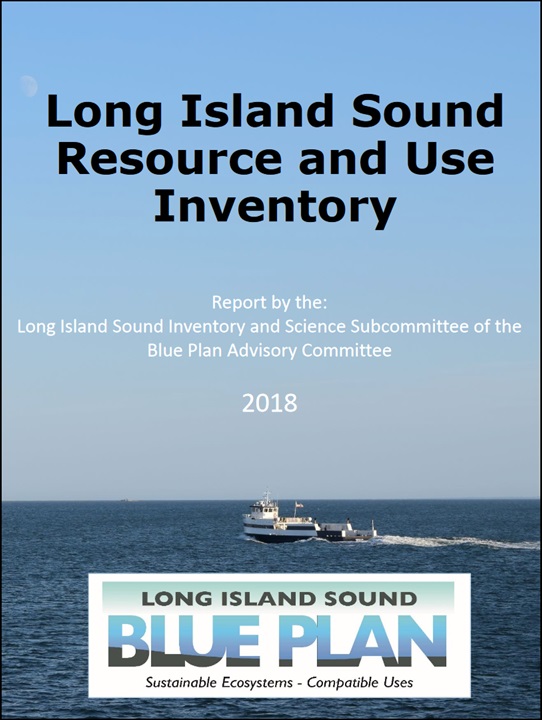
Though it is dated 2018, the Long Island Sound Resource and Use Inventory 294-page report linked to this image is valuable for looking at the region and planning for the present, into the future. And it is full of ideas for writers and educators.
Additional information at www.ct.gov/deep/lisblueplan.
Filter sample data sample selection by town, waterbody or fish species, macroinvertebrate details (where available). An interactive ESRI map of CT ECO is the collaborative work of the CT Dept. of Energy and Environmental Protection (DEEP) and the UConn’s Center for Land Use Education and Research (CLEAR) to share environmental and natural resource information with the general public. CT DEEP Fish Community Data – Inland Waters part of the enormous data details available to the public.
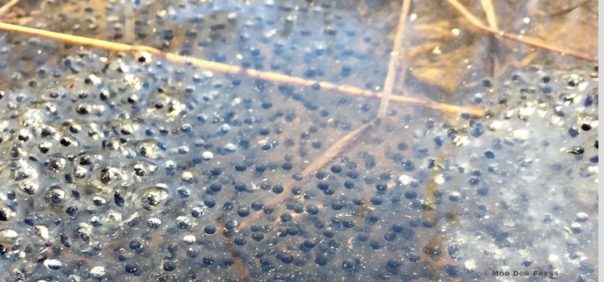
Frogs to be.
Some background: “Agencies at federal, state, and local levels increasingly need to work together along with stakeholders to address these challenges. Decisions need to be informed by a consistent ecological and socioeconomic context and an understanding of the various interactions between offshore and coastal resources and activities. In the case of Long Island Sound, effective decision-making requires access to regional scale data and information, guidance for using the data, and opportunities for government agencies and stakeholders to improve collaboration around the use of data to inform management of coastal and offshore resources and activities.
“In May of 2015, the CT legislature passed Public Act 15-66, the “Blue Plan” legislation – launching an official marine spatial planning process for Long Island Sound.”
In 2015, prior to creating a new website, Connecticut Environmental Conditions Online (CT ECO) conducted a survey and received valuable feedback and comments. Read them at this link. Also pretty interesting, here is a sampling, which can lead to resource-rich tangents for researchers and writers:
“Additional historical aerial imagery. Some years or aerial photos are not georeferenced, but their indices are. It would be great if the 1974 images (and others) could be georeferenced and displayed while panning around. Other years I think are not online at all: 1968 and 1954 or is it 1955?
“Some historical aerial imagery is online at UConn MAGIC and the CT State Library here and here. Yes, it would make sense to have some of the data more integrated.
“Other Layers old USGS maps.
“These exist as a map service here. Using ArcGIS Online and CT ECO, the topo maps can be combined with any map service on CT ECO.”
Learning, sharing knowledge about all that lives in the waters of Connecticut. MDP file image from a BioBlitz on the Connecticut River near East Hartford.
And. Connecticut DEEP and UConn CLEAR have “collaborated on a project to make Connecticut’s freshwater fish community data (historical and current) available to the public*. This new Fish Community Data Viewer allows users to search DEEP fish or macroinvertebrate community data for inland waters by town, waterbody or fish species. Fish and macroinvertebrate counts are available for more than 2,270 sample sites across Connecticut. *While a majority of the fish community data that has been collected by DEEP is represented on this viewer, it is not all of the data that has been collected. We encourage all users of this viewer to contact fisheries at 860-424-FISH or deep.inland.fisheries@ct.gov to make sure all data are made available.
Visit the info/help and viewer tabs to learn more and explore the data.” For more about data, contact deep.inland.fisheries(at)ct.gov; (860) 424-FISH. Note disclaimer “Please be aware of the sample year.”
From the site, about data contributors to CT ECO (includes environmental and natural resource information in addition to orthophotography either acquired or maintained by the following federal, regional, state agencies and universities.)
Capitol Region Council of Governments (CRCOG) – 2009 Capitol Region Council of Governments Orthophotography, 2016 Statewide Orthophotography and Lidar.
Connecticut Department of Emergency Management and Homeland Security (DEMHS) – Hurricane Surge Inundation.
Connecticut Department of Energy and Environmental Protection (DEEP) – Connecticut 2004 Orthophotography, Connecticut 2005 Coastal Color Infrared Orthophotography, Connecticut 2010 Coastal Color and Infrared Orthophotography, Aquifer Protection Areas, Critical Habitats, DEP Property, Drainage Basins, Federal Open Space, 1997 Municipal and Private Open Space, Lake Bathymetry, Natural Diversity Data Base Areas, Protected Open Space Mapping, Parcels for Protected Open Space Mapping, Quaternary Geology, Water Quality Classifications.
Connecticut Department of Emergency Services and Public Protection (DESPP) (formerly the Department of Public Safety) – Connecticut 2004 Orthophotography, Connecticut 2012 Orthophotography, Connecticut 2016 Orthophotography.
Connecticut Department of Transportation (DOT) – Connecticut 2004 Orthophotography, DOT Scenic Land Strips, Connecticut 2012 Orthophotography, Connecticut 2016 Orthophotography and Lidar.
Connecticut Office of Policy and Management (OPM) – Protected Open Space Mapping, Parcels for Protected Open Space Mapping, 2009 Capitol Region Council of Governments Orthophotography, Connecticut 2016 Orthophotography and Lidar.
National Oceanic and Atmospheric Administration, Office of Coastal Management (NOAA OCM) (formerly NOAA Coastal Services Center)- Coastal Connecticut 2004 Color Orthophotography, Coastal Connecticut 2004 Color Infrared Orthophotography.
University of Connecticut, Center for Land Use Education and Research (UConn CLEAR) – Connecticut Shaded Relief and Hillshade based on a Statewide Lidar (2000), Connecticut 2006-2014 Statewide Lidar Mosaic, Connecticut Land Cover.
University of Connecticut, College of Agriculture, Health and Natural Resources (UConn CAHNR) – Connecticut two-foot contours based on statewide Lidar 2000 dataset.
U.S. Army Corps of Engineers (USACE) – Hurricane Surge Inundation.
U.S. Department of Agriculture, Farmland Service Agency, Aerial Photography Field Office – Connecticut 2006 NAIP Orthophotography, Connecticut 2008 NAIP Orthophotography, Connecticut 2010 NAIP Orthophotography, Connecticut 2012 NAIP Orthophotography, Connecticut 2014 NAIP Orthophotography, Connecticut 2016 NAIP Orthophotography.
U.S. Department of Agriculture, Natural Resources Conservation Service (USDA NRCS) – Connecticut 1990 Orthophotography, Soils, Farmland Soils, Hydric Soils, Inland Wetland Soils, Potential for Subsurface Sewage Disposal System, Soil Parent Materials, Soil Drainage Class, Soil Flooding Class
U.S. Geological Survey (USGS) – Connecticut 1990 Orthophotography, Connecticut 2008 Urban Area Orthophotography, Quaternary Geology, Surficial Materials, Connecticut 2006-2014 Statewide Lidar Mosaic.
Note: Update March 11, 2020; story published March 1, 2020. The full report is page after page of interesting data, maps, resources — well worth reading. For those looking for area happenings and other information since many events are being cancelled, visit our events page.
One excerpt: “Unique archaeological resources are likely to be found in submerged environments; the colder temperatures, lower oxygen levels, and more consistent conditions can preserve organic materials that would decompose in the acidic terrestrial soils of New England.”